Media Gallery
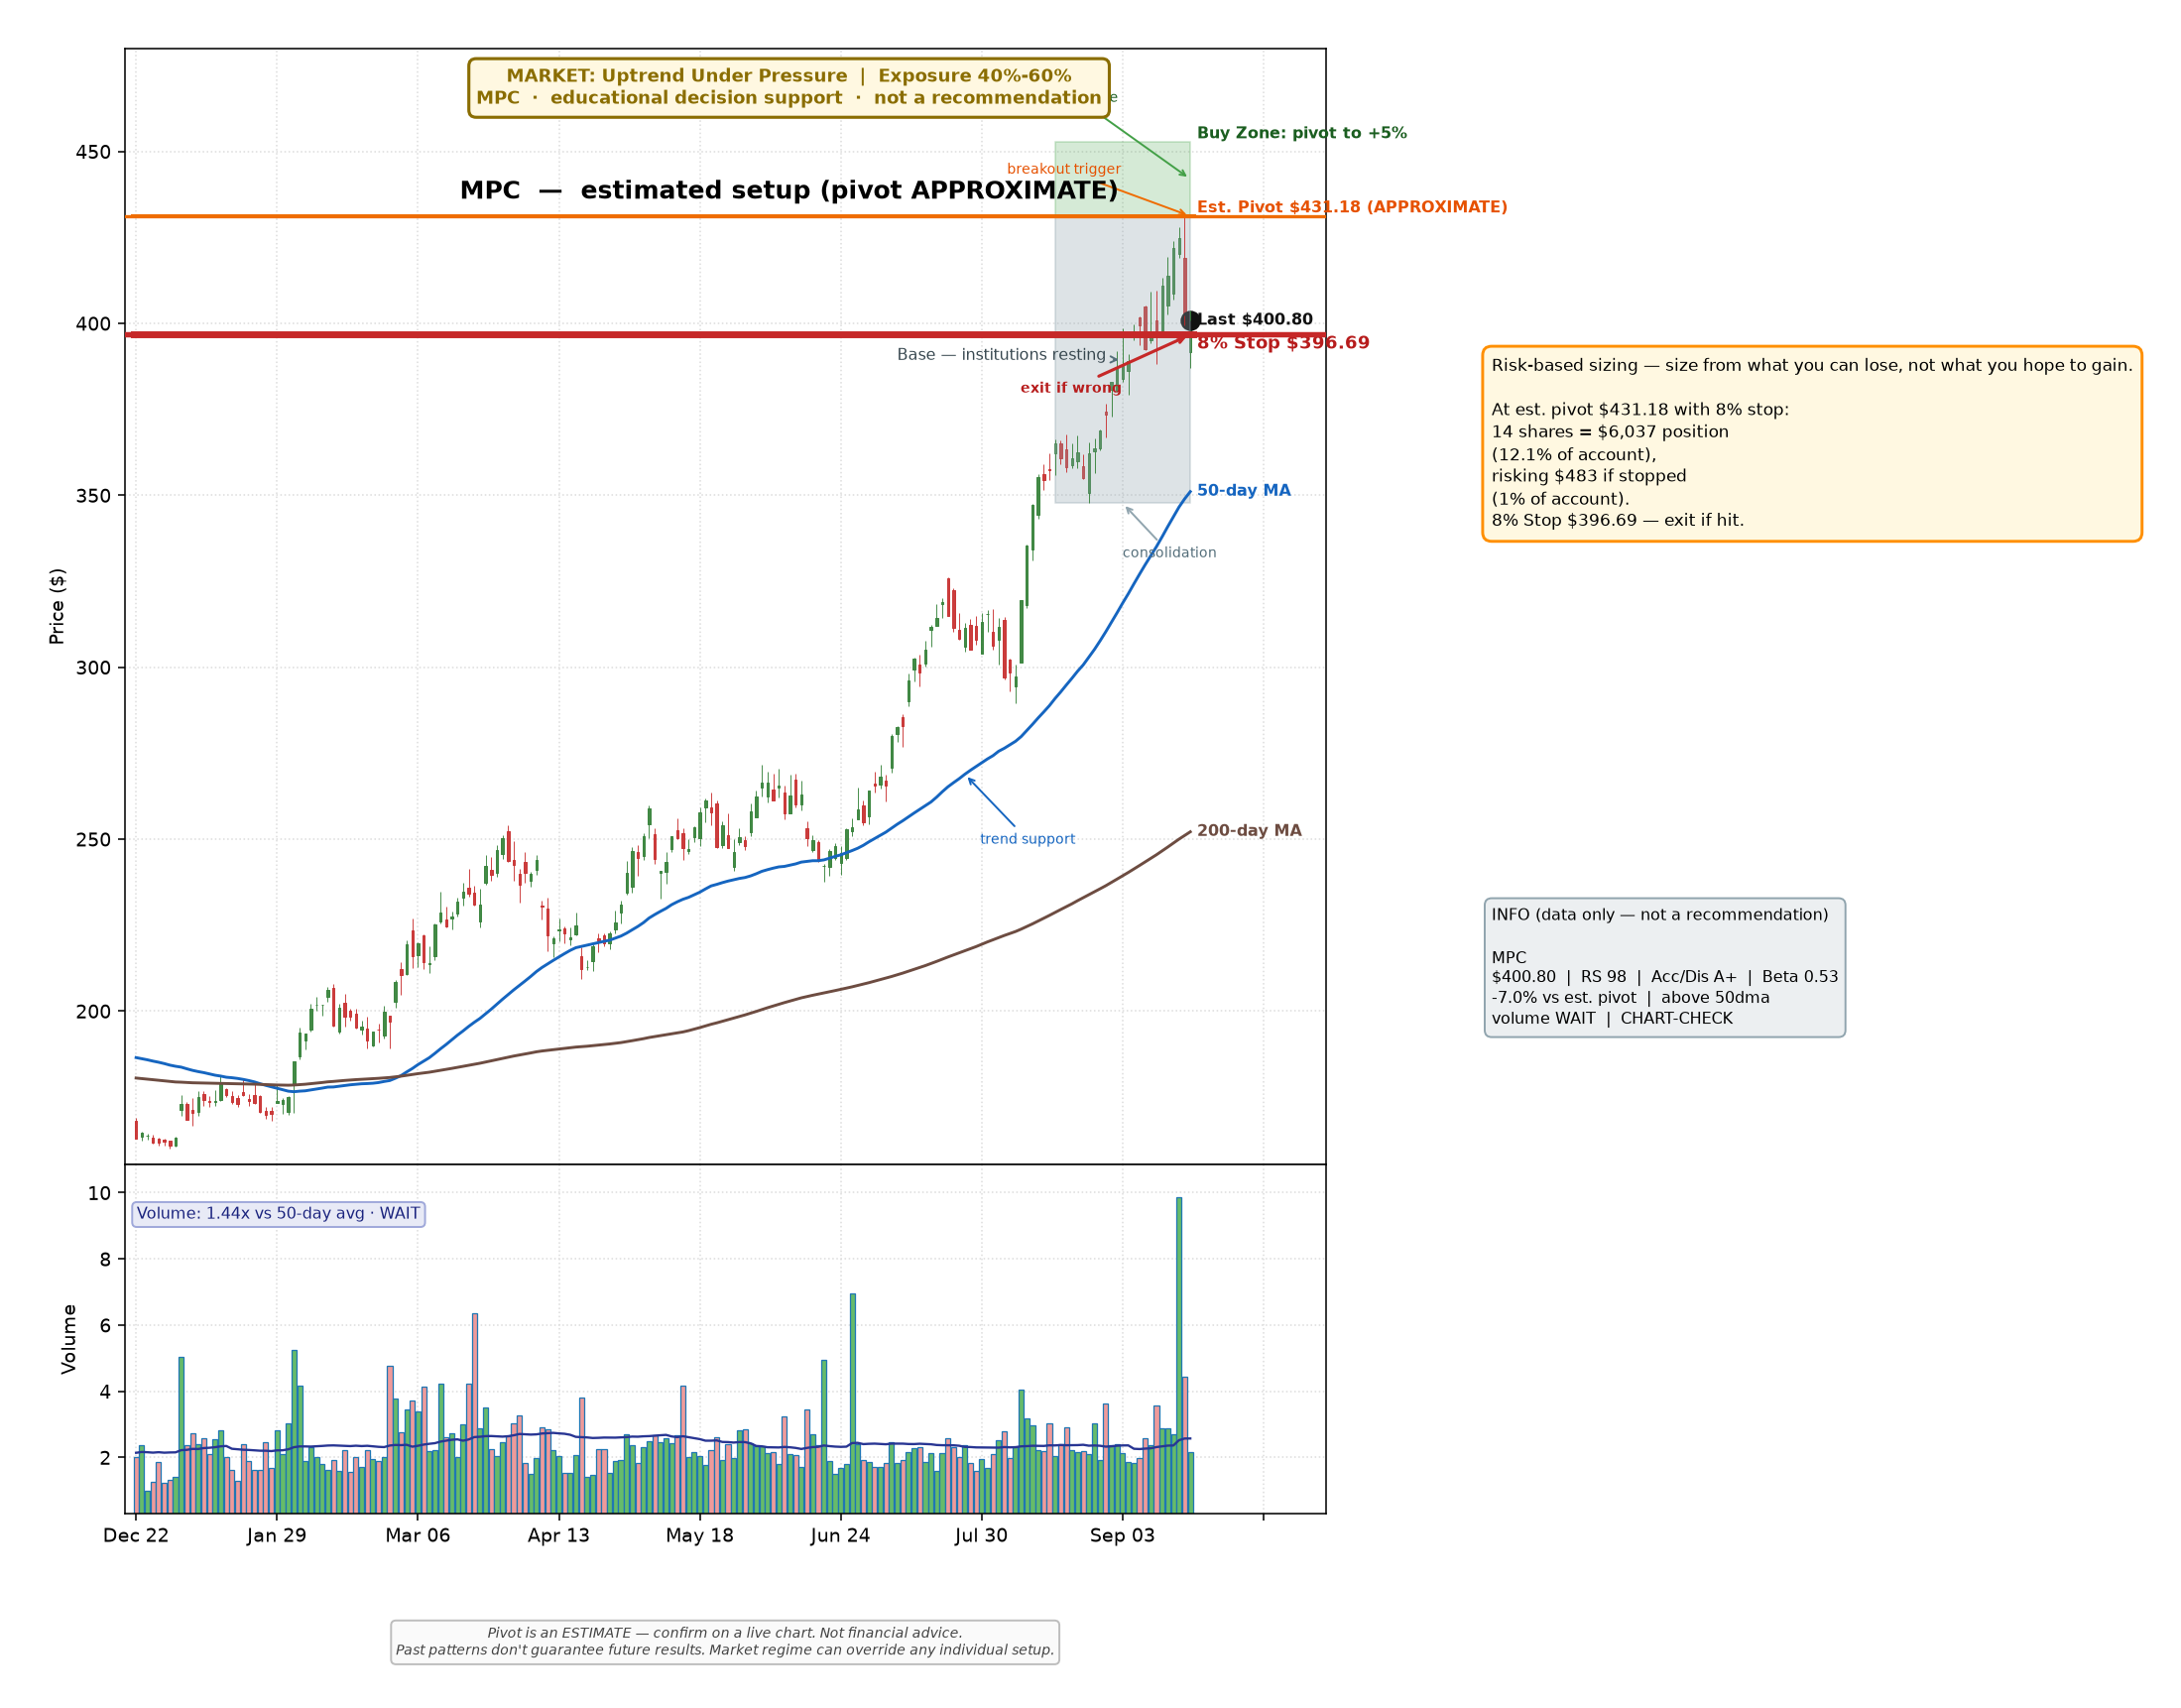
Example educational decision-support charts produced by the private
operator pipeline (generate_charts.py). These show mechanics,
risk, regime, and uncertainty — not buy/sell recommendations.
Pivot levels are labeled APPROXIMATE. Position sizing on sample charts is illustrative; live account values are not published here.
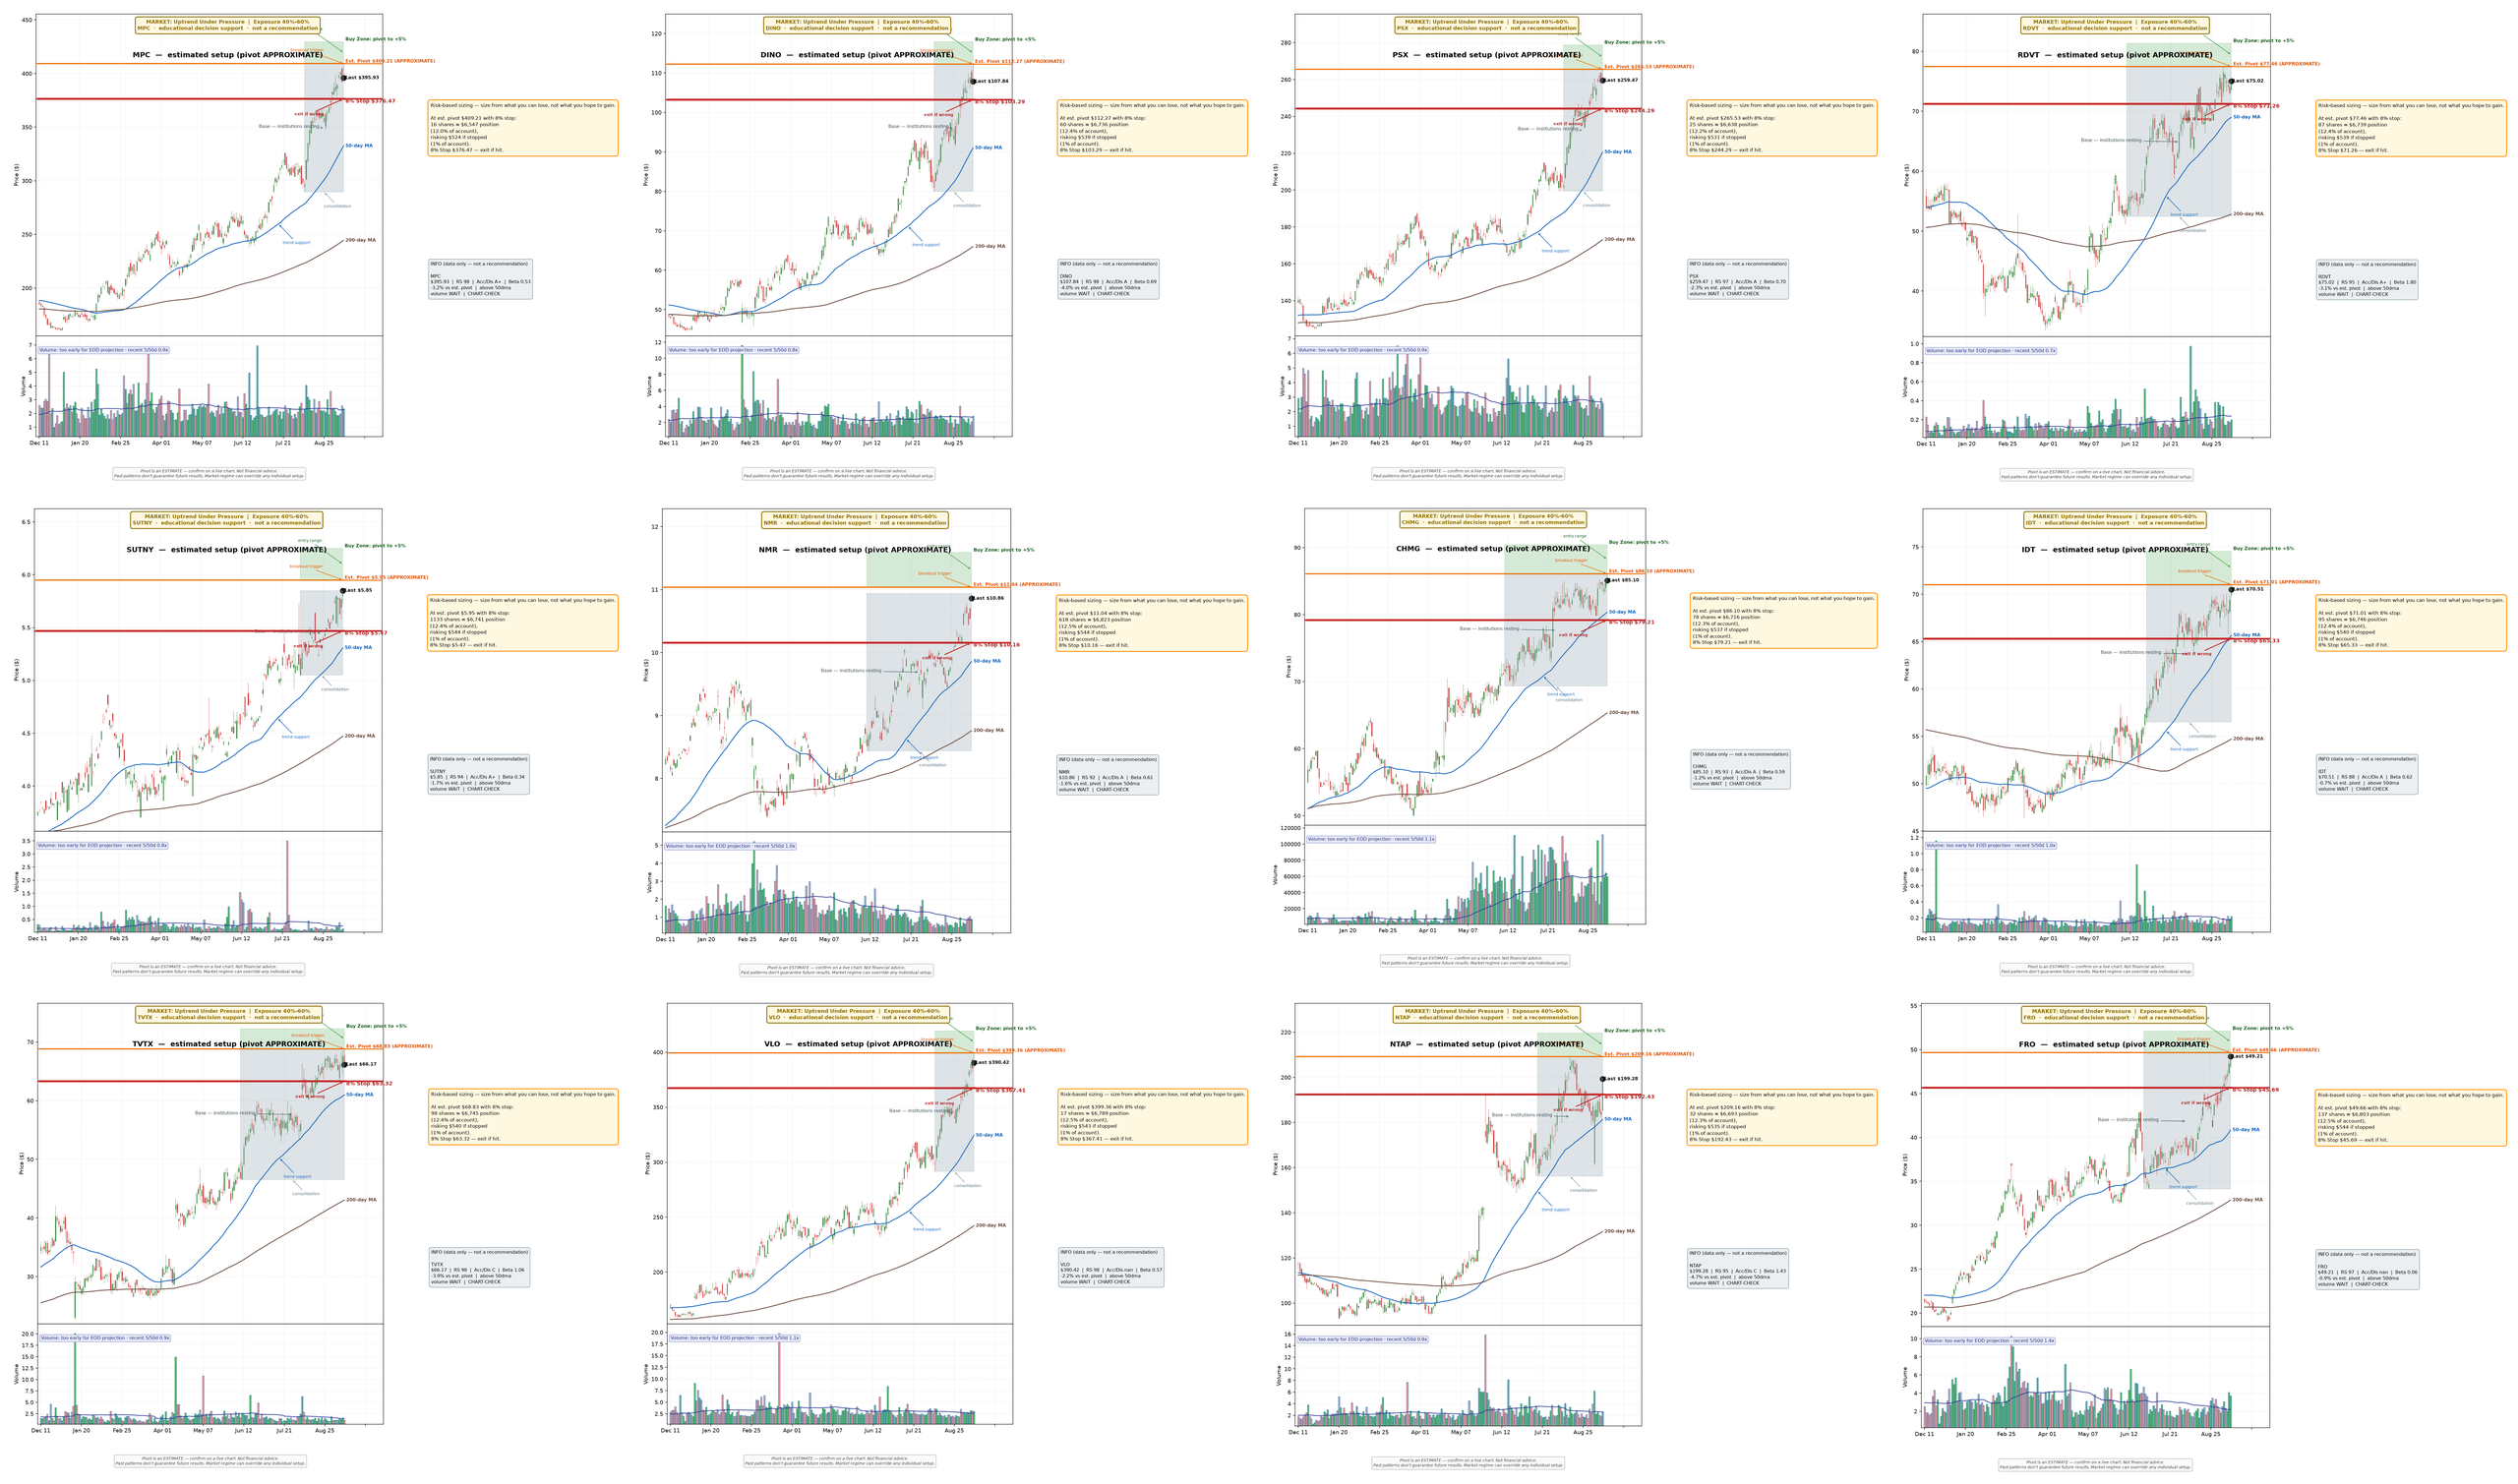
Sample contact sheet (W38 in-zone names)
Sample single-name chart (illustrative sizing)
Generated with a round $50,000 account assumption for public display (not a live account balance).